Dive into our blogs, freshly moved to Medium!
You can now browse all our posts below. Use the search to find what you're looking for, and click any blog to read the full article on Medium.
No Results Found
Hmm... we couldn’t find any blogs matching your search.
We've logged your keyword, and it’s now on our radar. New posts coming soon—thanks for the nudge!
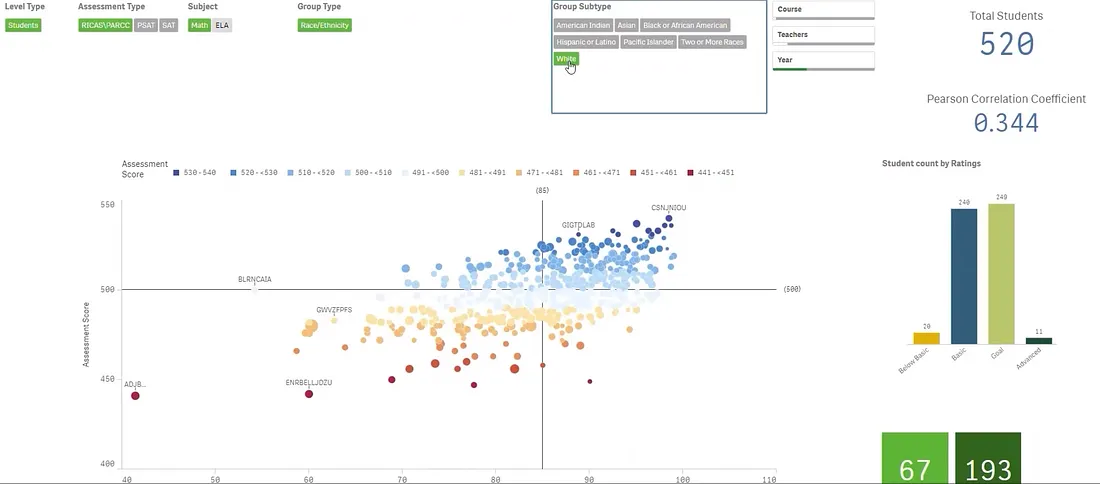
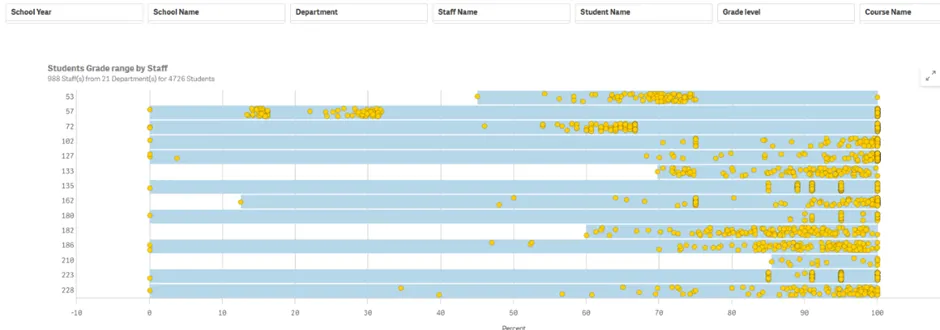
Analyzing five years of student data in a Rhode Island K-12 district to uncover how high school grades relate to standardized test scores.
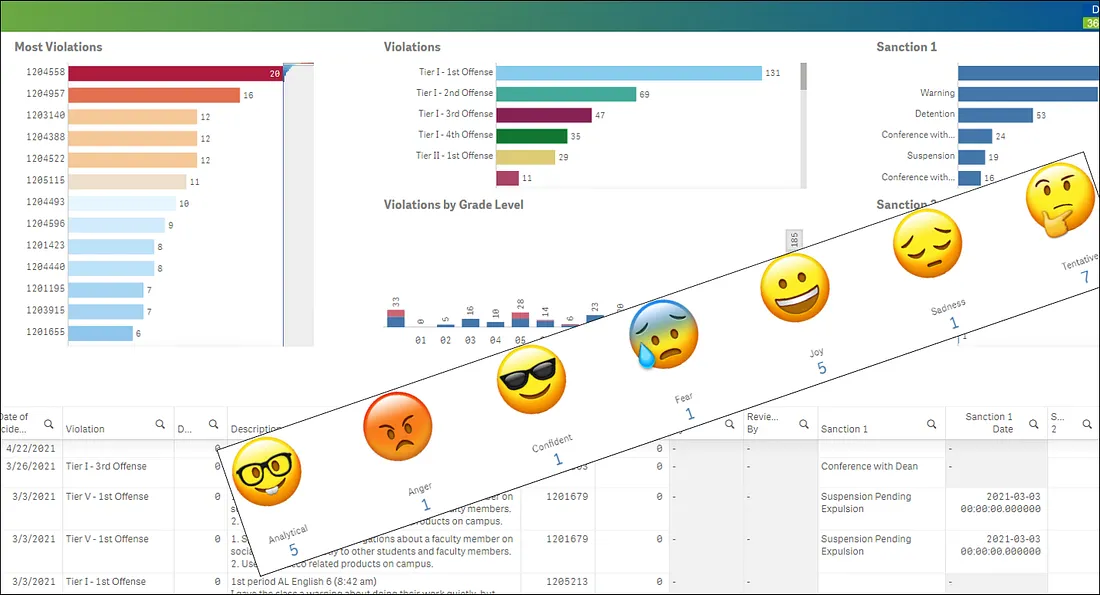
Exploring why true educational insights go beyond test scores and attendance, factoring in discipline records and academic notes.
The blog highlights how Qlik’s Associative Data Model speeds up data analysis compared to traditional SQL-based reporting.
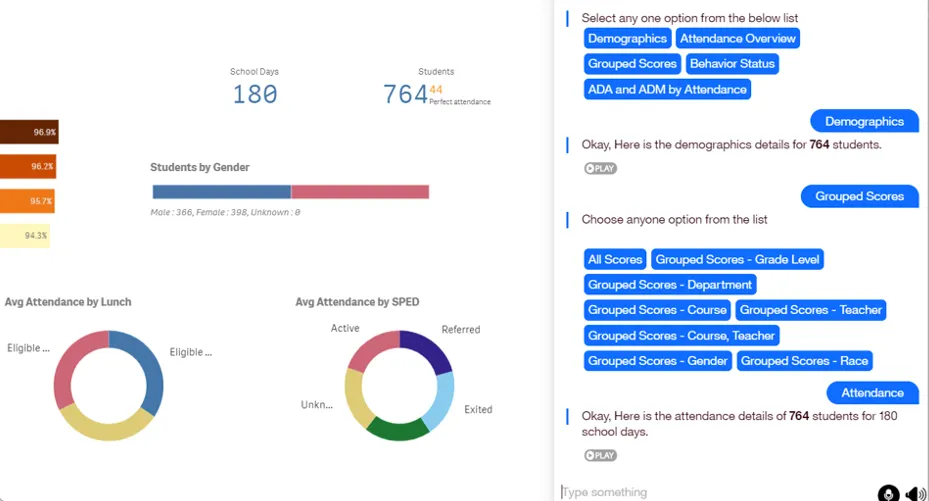
District 360 is an AI assistant that helps K-12 educators make data-driven decisions with instant, detailed answers for targeted interventions.
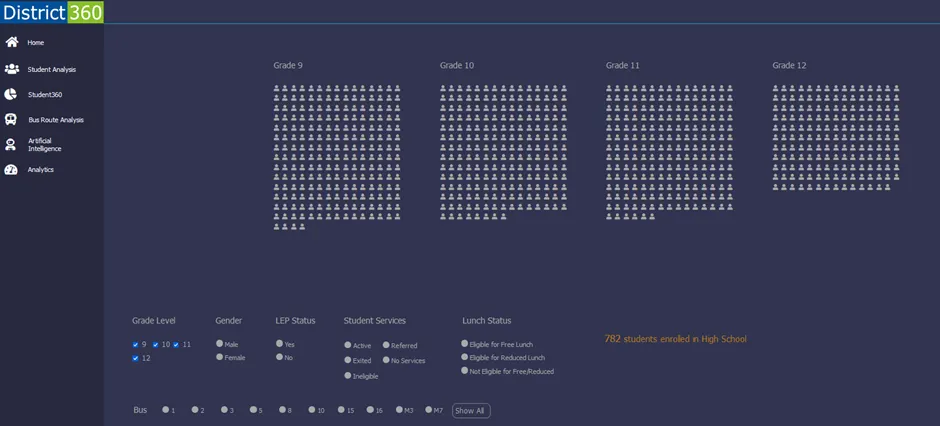
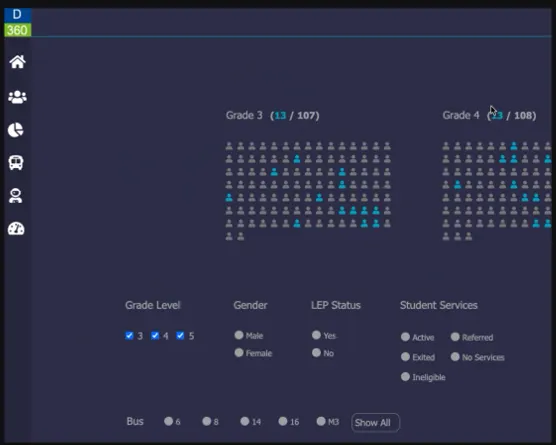
District 360 helps educators shift from class-level views to student-level insights for personalized interventions.
District 360 found that transportation barriers, especially limited MBTA access, drive chronic absenteeism.
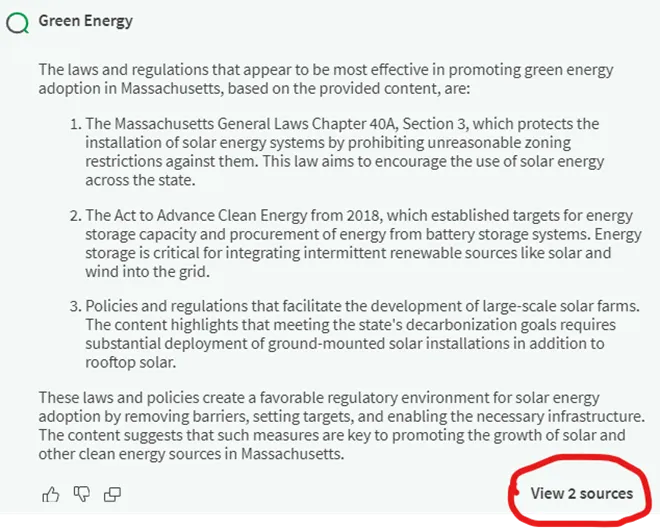
Qlik Answers transforms documents into verified insights, enabling faster, data-driven decisions without costly custom AI.
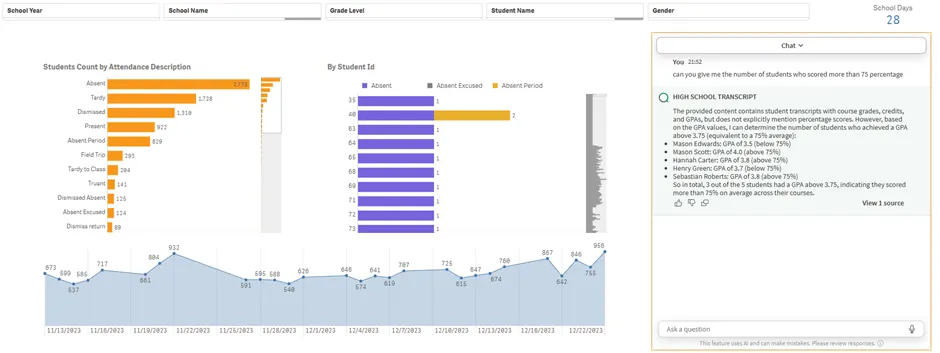
Qlik Answers uses Generative AI to turn K-12 transcripts and report cards into source-verified insights for smarter decisions.
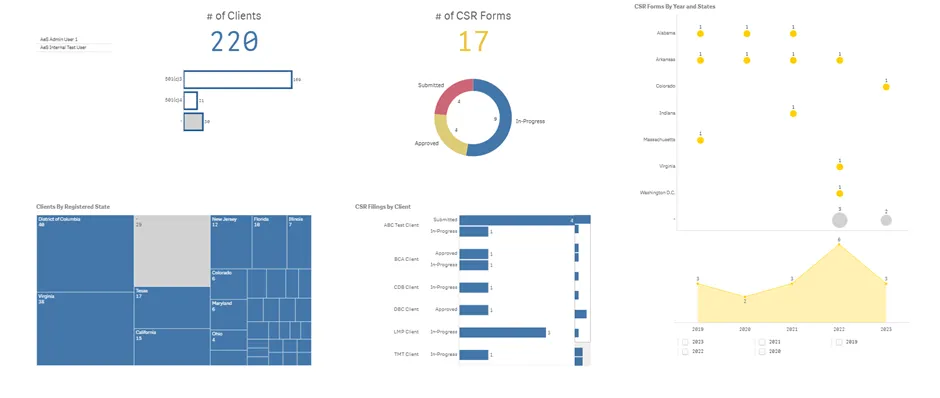
Qlik Sense transforms Salesforce data into clear insights with interactive dashboards and automated reporting.
District 360 unifies SIS data into interactive dashboards, breaking silos and delivering insights to boost student and teacher performance.
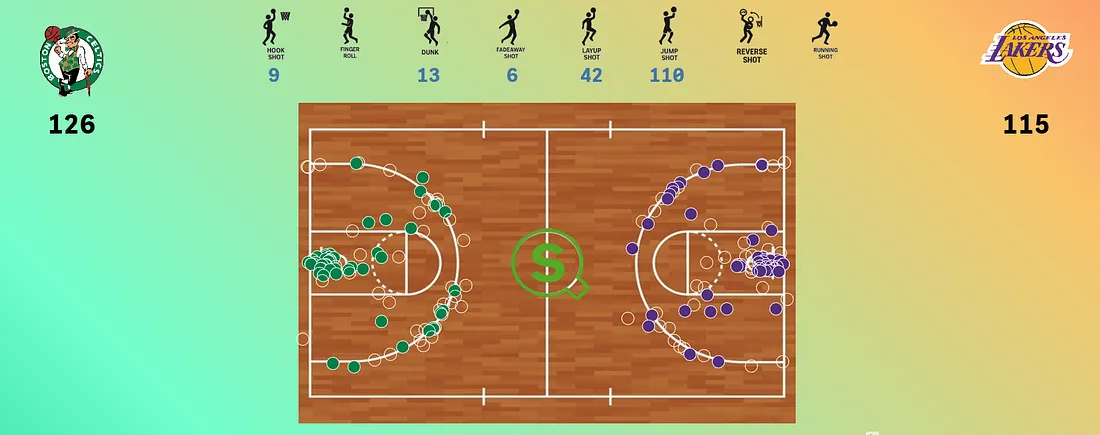
Experience Celtics vs. Lakers like never before with a Qlik Sense dashboard that brings game data to life through AI and real-time interactivity.
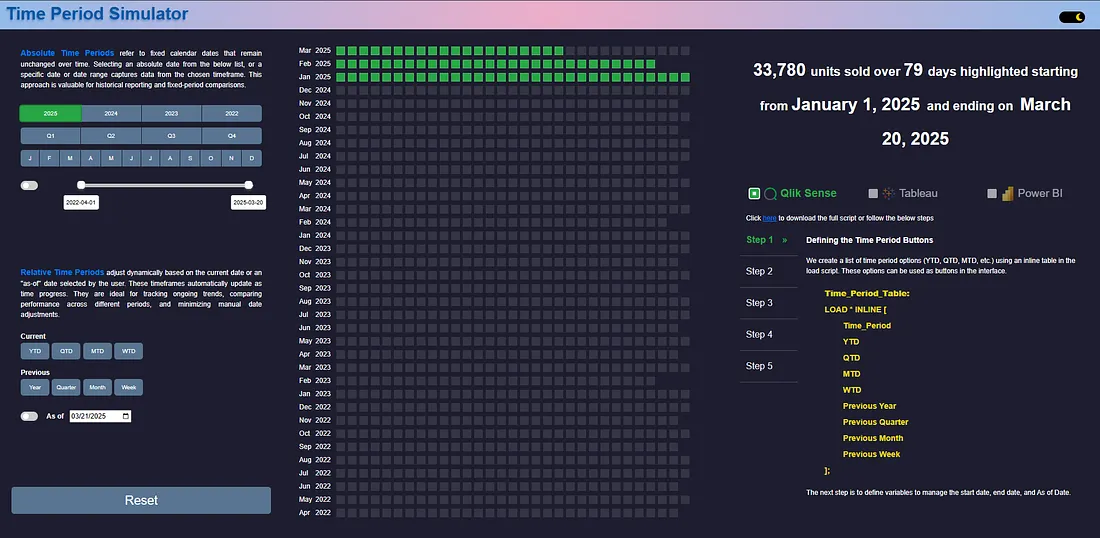
The Time Period Simulator helps BI users master YTD, QTD, and MTD with interactive visuals across Qlik Sense, Tableau, and Power BI.
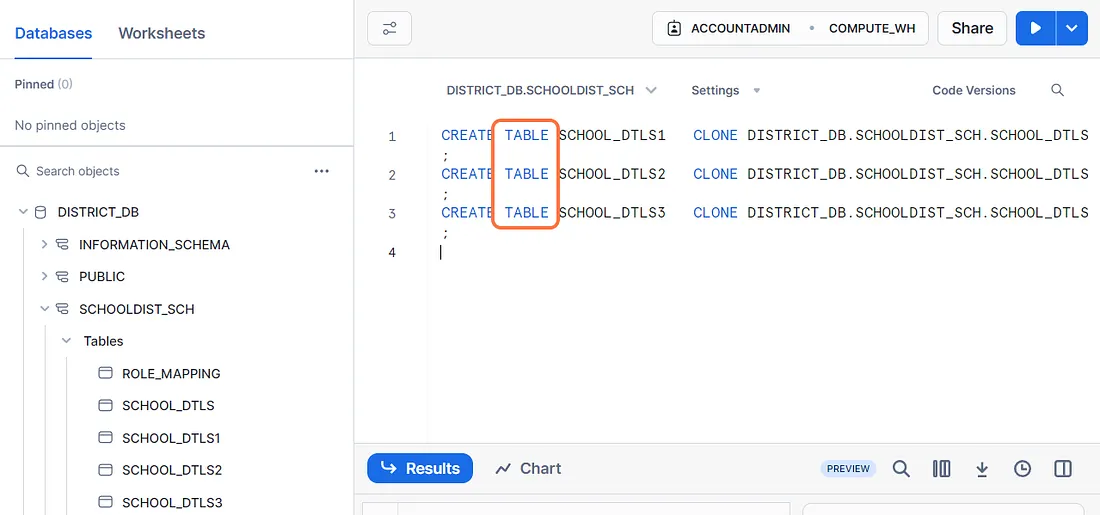
Snowflake’s Zero-Copy Cloning instantly replicates data without extra storage, simplifying management and accelerating development.
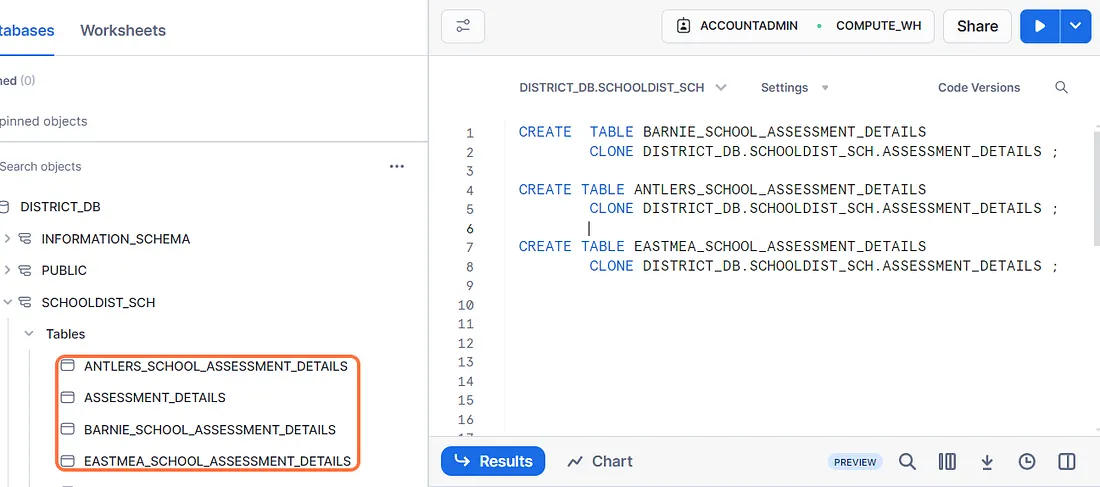
Securely share school assessment data with Snowflake cloning and row-level policies, ensuring school-specific access with cost efficiency.
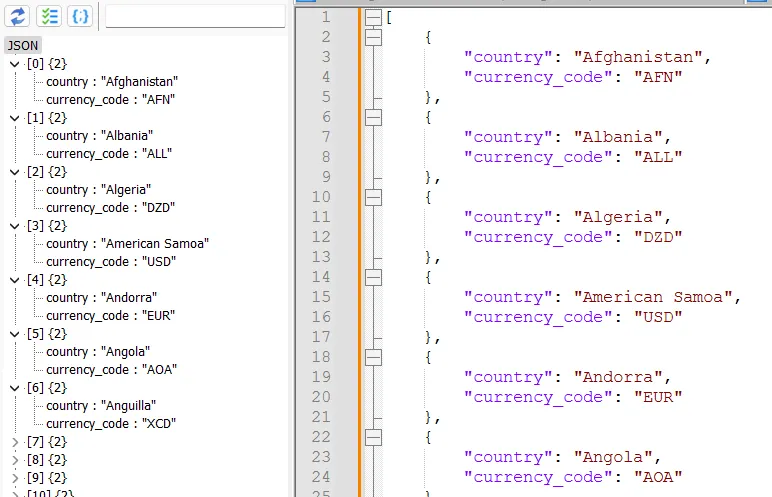
Learn to handle JSON in Snowflake with VARIANT and LATERAL FLATTEN for seamless semi-structured data management.
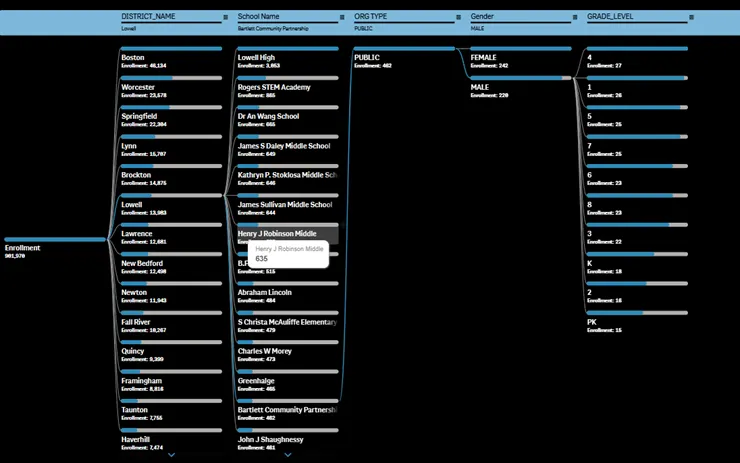
Decomposition Charts let you explore enrollment by grade, gender, and more to uncover trends and insights.
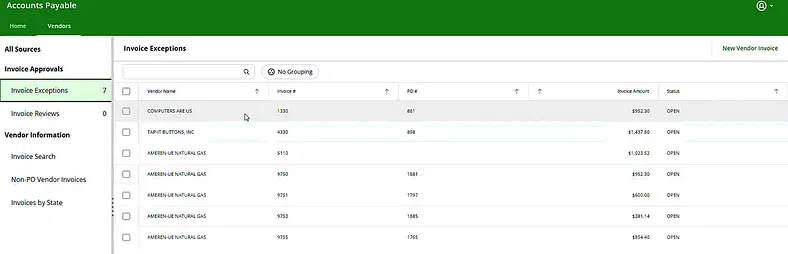
OnBase App Builder lets you create no-code web apps with search, forms, workflows, and dashboards to streamline tasks and boost efficiency.
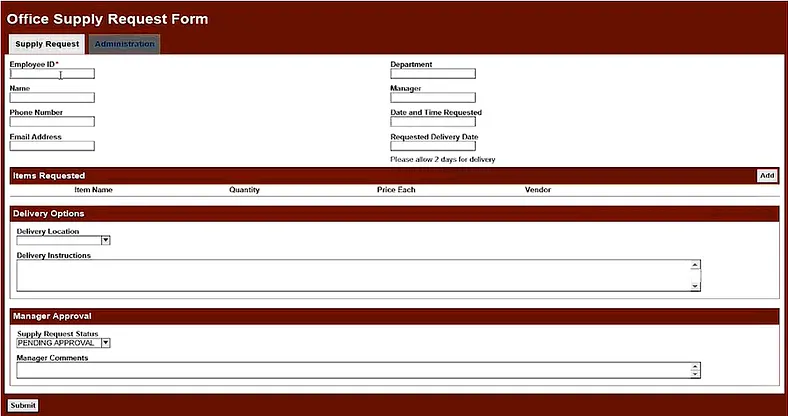
Unity Forms are next-gen OnBase e-forms with a point-and-click designer, automation, and validations to streamline processes.
Data Growth Dashboard visualizes patterns, clusters buildings by performance, and reveals emissions insights for targeted sustainability.
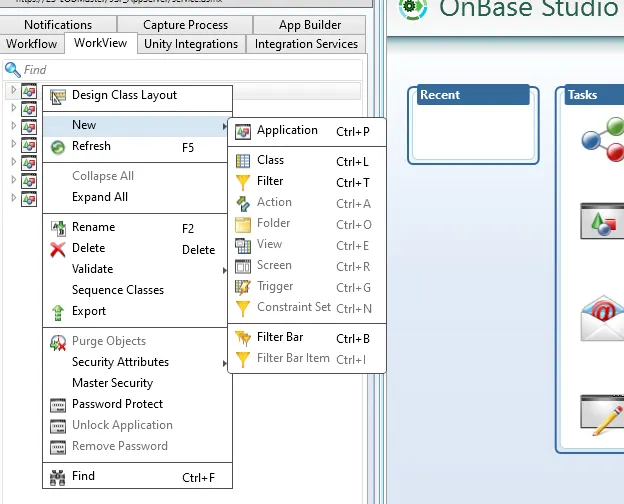
OnBase WorkView is a low-code platform to centralize data, automate workflows, and boost efficiency.
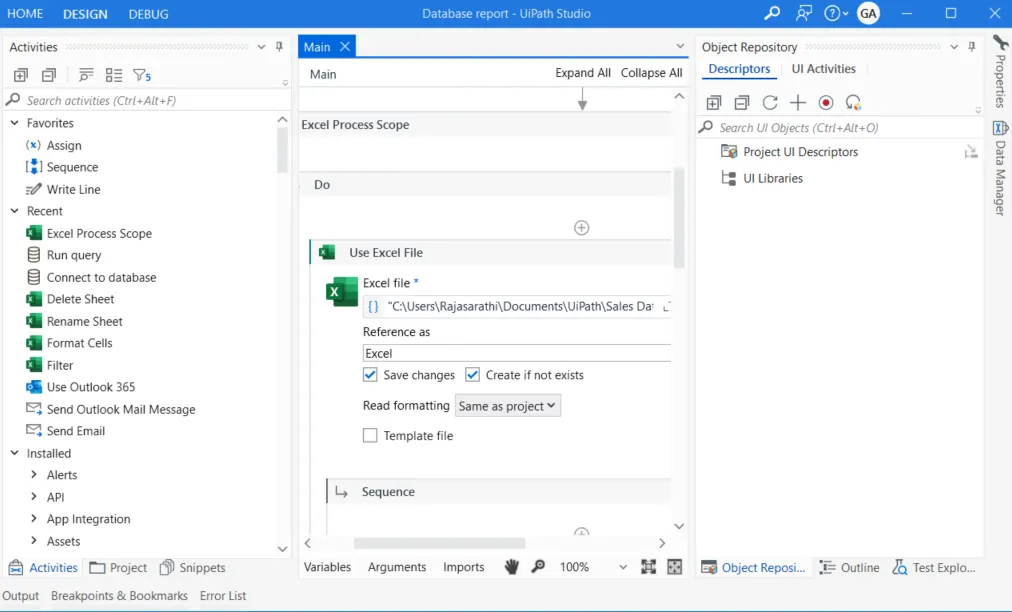
Assure automated daily sales reports with UiPath, connecting SQL to Excel and email to save time and improve accuracy.
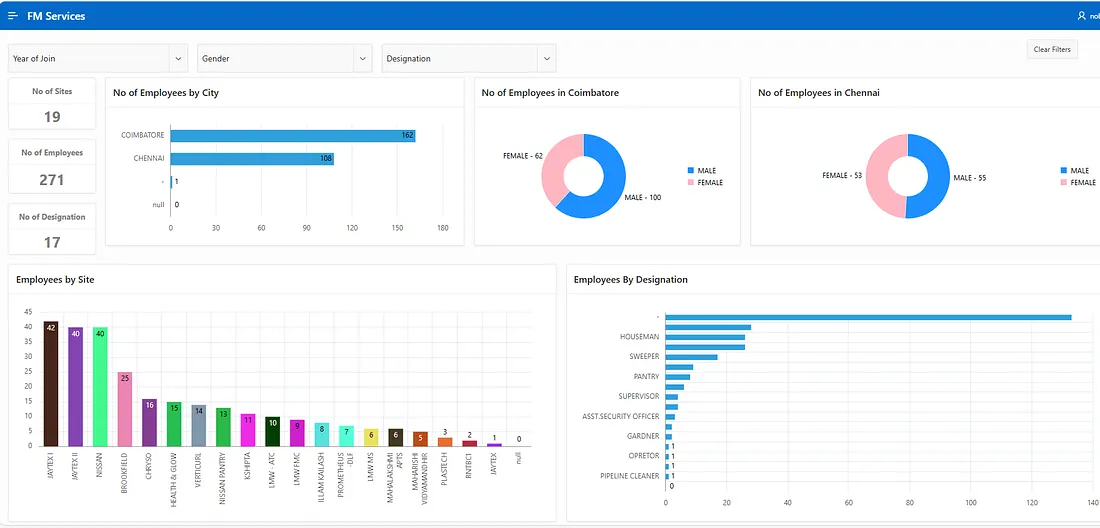
Modernizing Facility Management with Oracle APEX by digitizing workflows, automating payroll, and boosting transparency.
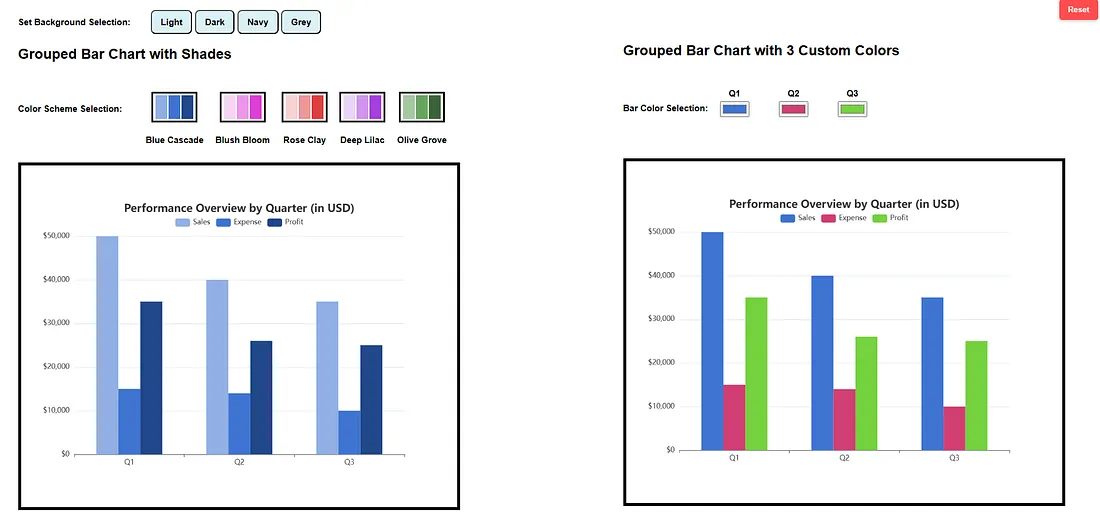
Tool-agnostic tips for designing clear, purposeful, and easy-to-navigate dashboards with smart colors and simple customization.
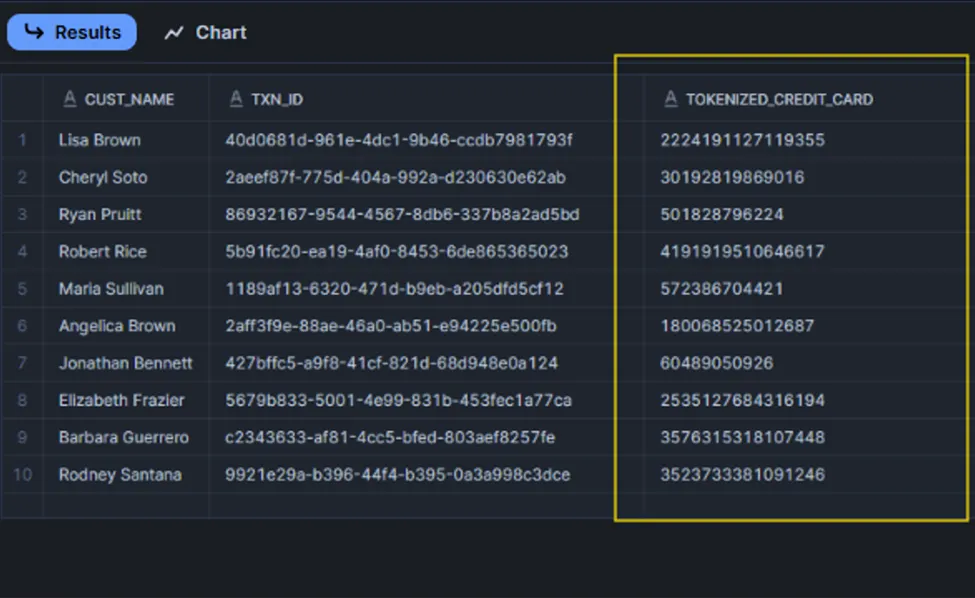
A hybrid Snowflake-GCP tokenization strategy secures PII, preserves analytics, and ensures compliance.